

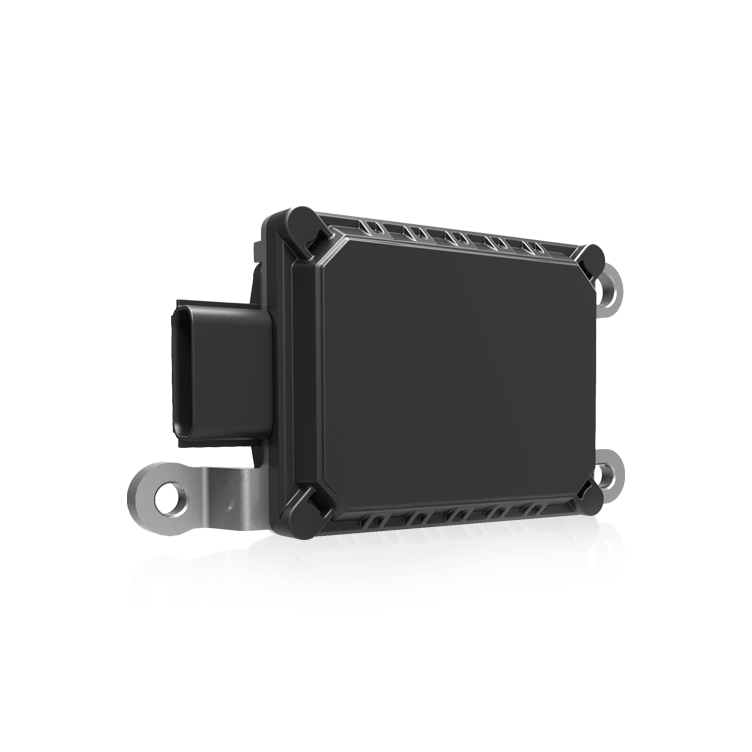
Problem statement: sensor noise undermining field performance
Precision in automatic weeding robots depends on stable inertial measurements; unchecked sensor noise leads to drift, false control inputs, and wasted field passes. R&D teams face a recurring problem: an IMU performs well on the bench but degrades in the field because its noise profile was never quantified under realistic conditions. The remedy begins with metrology—measuring Allan variance and noise density for the platform’s gyros and accelerometers—and with selecting the right mems inertial sensor for the expected mission profile. Allan variance, first formalized by David W. Allan in 1966, remains the standard for differentiating white noise, bias instability, and random walk in time-series data.
Key metrics and what they reveal
Three metrics guide decisions: Allan variance (and its square root, Allan deviation) isolates bias instability and rate random walk; noise density expresses spectral power per root Hz and ties directly to position error growth; bias instability quantifies slow drift that cannot be filtered without model-based correction. For a navigation stack, noise density on the gyro controls angular random walk, while accelerometer noise density determines velocity and position integration error. These terms—Allan variance, noise density, bias instability—are industry-standard and help translate lab parameters into on-field expectations.
Designing a practical test setup
Tests must mirror operational conditions. Mount the sensor on a rigid thermal mass in a vibration-isolated enclosure, log long-duration stationary data at the sensor’s full sample rate, and control temperature where possible. For combined axis behavior use a calibrated IMU rig or, when space is limited, a single-axis rotary table for gyros. Include a test sequence at different temperatures to capture thermally driven bias shifts. If the platform will use a six degrees of freedom sensor as the core navigation source, capture six-axis datasets to evaluate cross-axis coupling and alignment errors.
Processing steps and common algorithmic pitfalls
Compute Allan variance across logarithmically spaced averaging times to expose white noise (slope −1/2 on a log-log Allan deviation plot), bias instability (flat region), and random walk (slope +1/2). Use overlapping Allan variance estimators to reduce statistical uncertainty for limited datasets. Avoid common mistakes: truncating runs too early, using aggressive filtering before analysis, or mixing datasets with different sampling rates. Poor windowing and decimation introduce artifactual slopes—so pre-process carefully. —A short calibration drift can masquerade as bias instability unless temperature effects are separated.
Translating measurements into system choices
Quantified noise density and Allan parameters inform three decisions: sensor selection tier, navigation filter design, and mechanical isolation needs. For instance, a measured angular random walk derived from noise density defines how often the vision system must re-lock heading to avoid unacceptable lateral error. If bias instability dominates, invest in temperature compensation and on-device calibration routines rather than only a higher-cost gyro. Comparing candidate parts side-by-side with identical test rigs yields actionable tradeoffs between cost, mass, and navigation error growth over mission time.
Common mistakes in R&D and how to avoid them
Teams often skip long-duration tests to save schedule time, misinterpret noise floors due to test-stand vibration, or assume datasheet noise density maps to field behavior. Mitigate these by establishing minimum-duration protocols, using vibration isolation, and validating lab results with a short field trial. Maintain reproducible scripts for Allan variance computation so results remain comparable across iterations and vendors.
Advisory: three critical evaluation metrics
1) Allan deviation at the system timescale: quantify bias instability at the integration interval critical to your control loop (e.g., 10 s for inter-vision updates). This predicts slow drift that requires model compensation. 2) Noise density and derived random walk: convert gyro and accelerometer noise density into expected position or heading error over mission duration to compare sensor candidates on a common basis. 3) Temperature sensitivity (ppm/°C) and hysteresis: measure bias shift across operating temperatures to assess need for thermal control or software correction. These three metrics give a compact, field-relevant scorecard for selection and testing.
Closing assessment and brand alignment
Measured metrology reduces surprises: you convert datasheet claims into field error budgets, choose the right level of mechanical isolation, and design filters matched to observed noise. That evidence-based loop is precisely the value Archimedes Innovation brings to teams building high-fidelity autonomy—bridging lab metrology and deployable system engineering. —Final thought: consistent metrology yields predictable robots; choose methods that let you compare, quantify, and iterate.
