

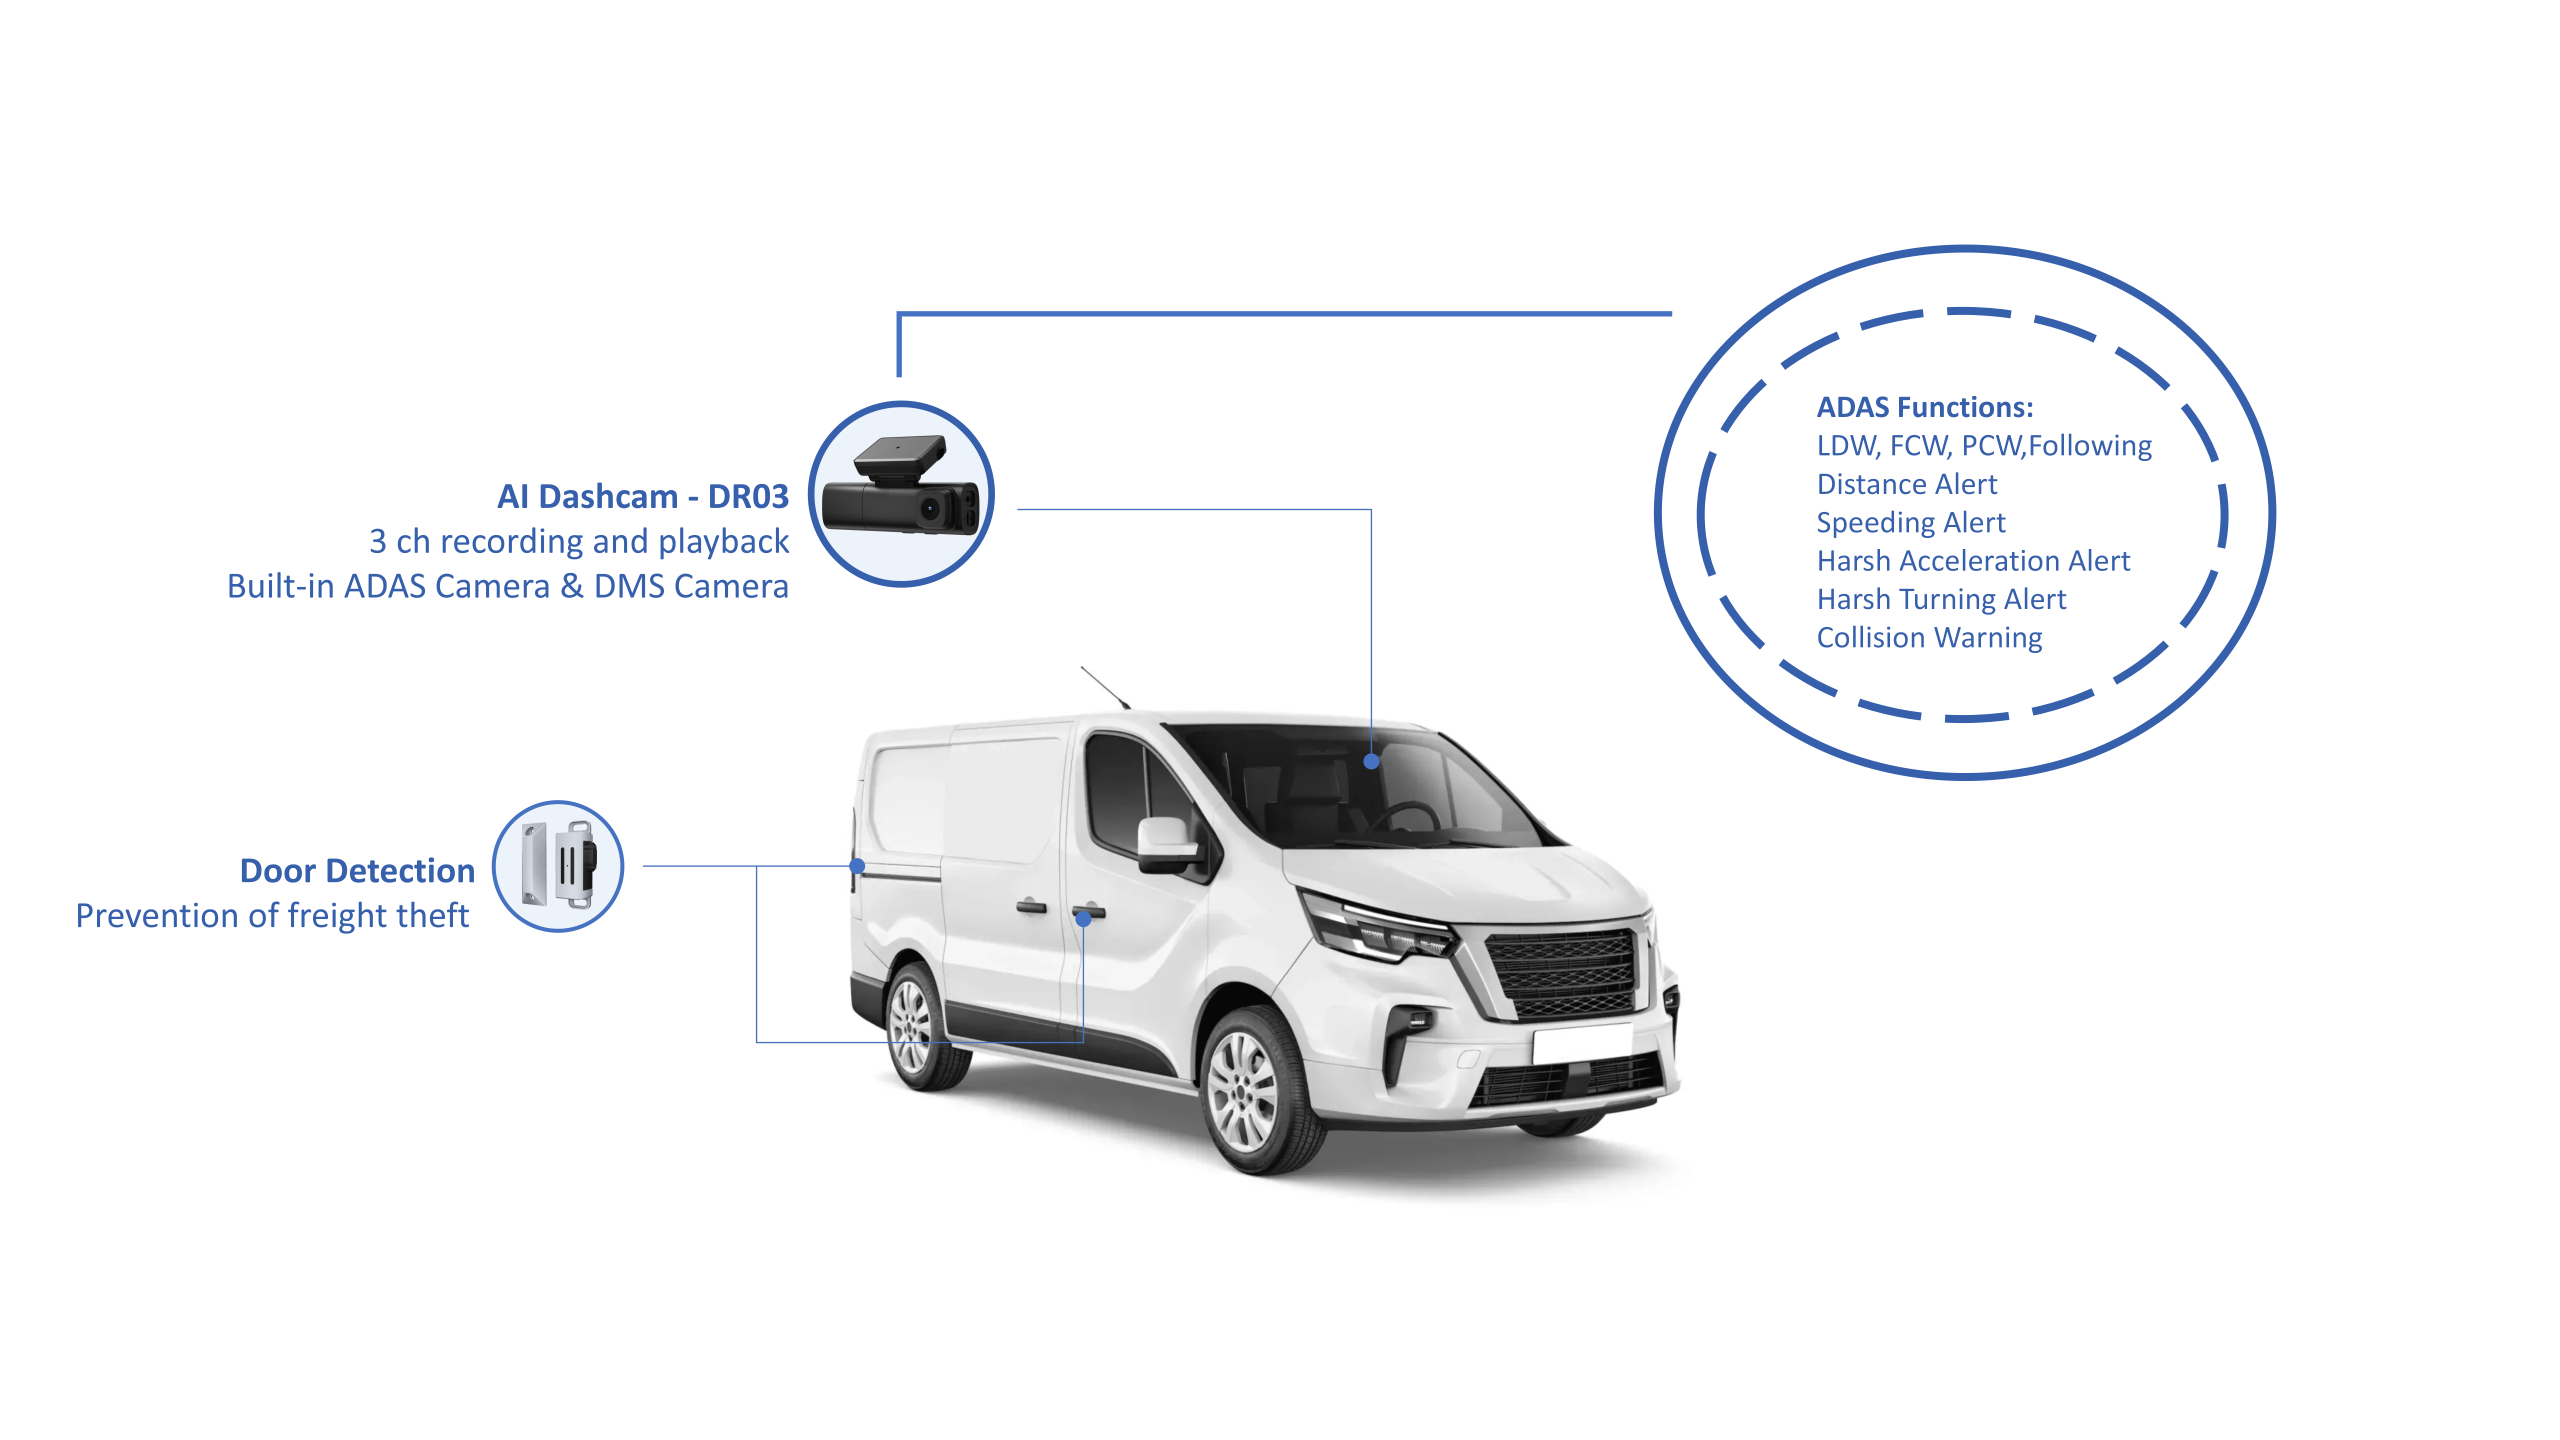
Diagnose the persistent failures
Too many van fleets miss targets because planners assume hardware, software, and operations will self-align. Start by naming the problems you observe: late deliveries, unexpected downtime, inflated fuel spend, route overlap, and missed compliance windows. Use a focused audit that includes a one-week telemetry snapshot, two-week driver feedback, and a spot inspection of maintenance logs. Include logistics fleet management telemetry from the start so baseline signals (GPS, engine hours, fault codes) are captured in a single dataset. Note: urban route density in London often exaggerates routing inefficiencies—treat dense-city data as a distinct case when you model performance.
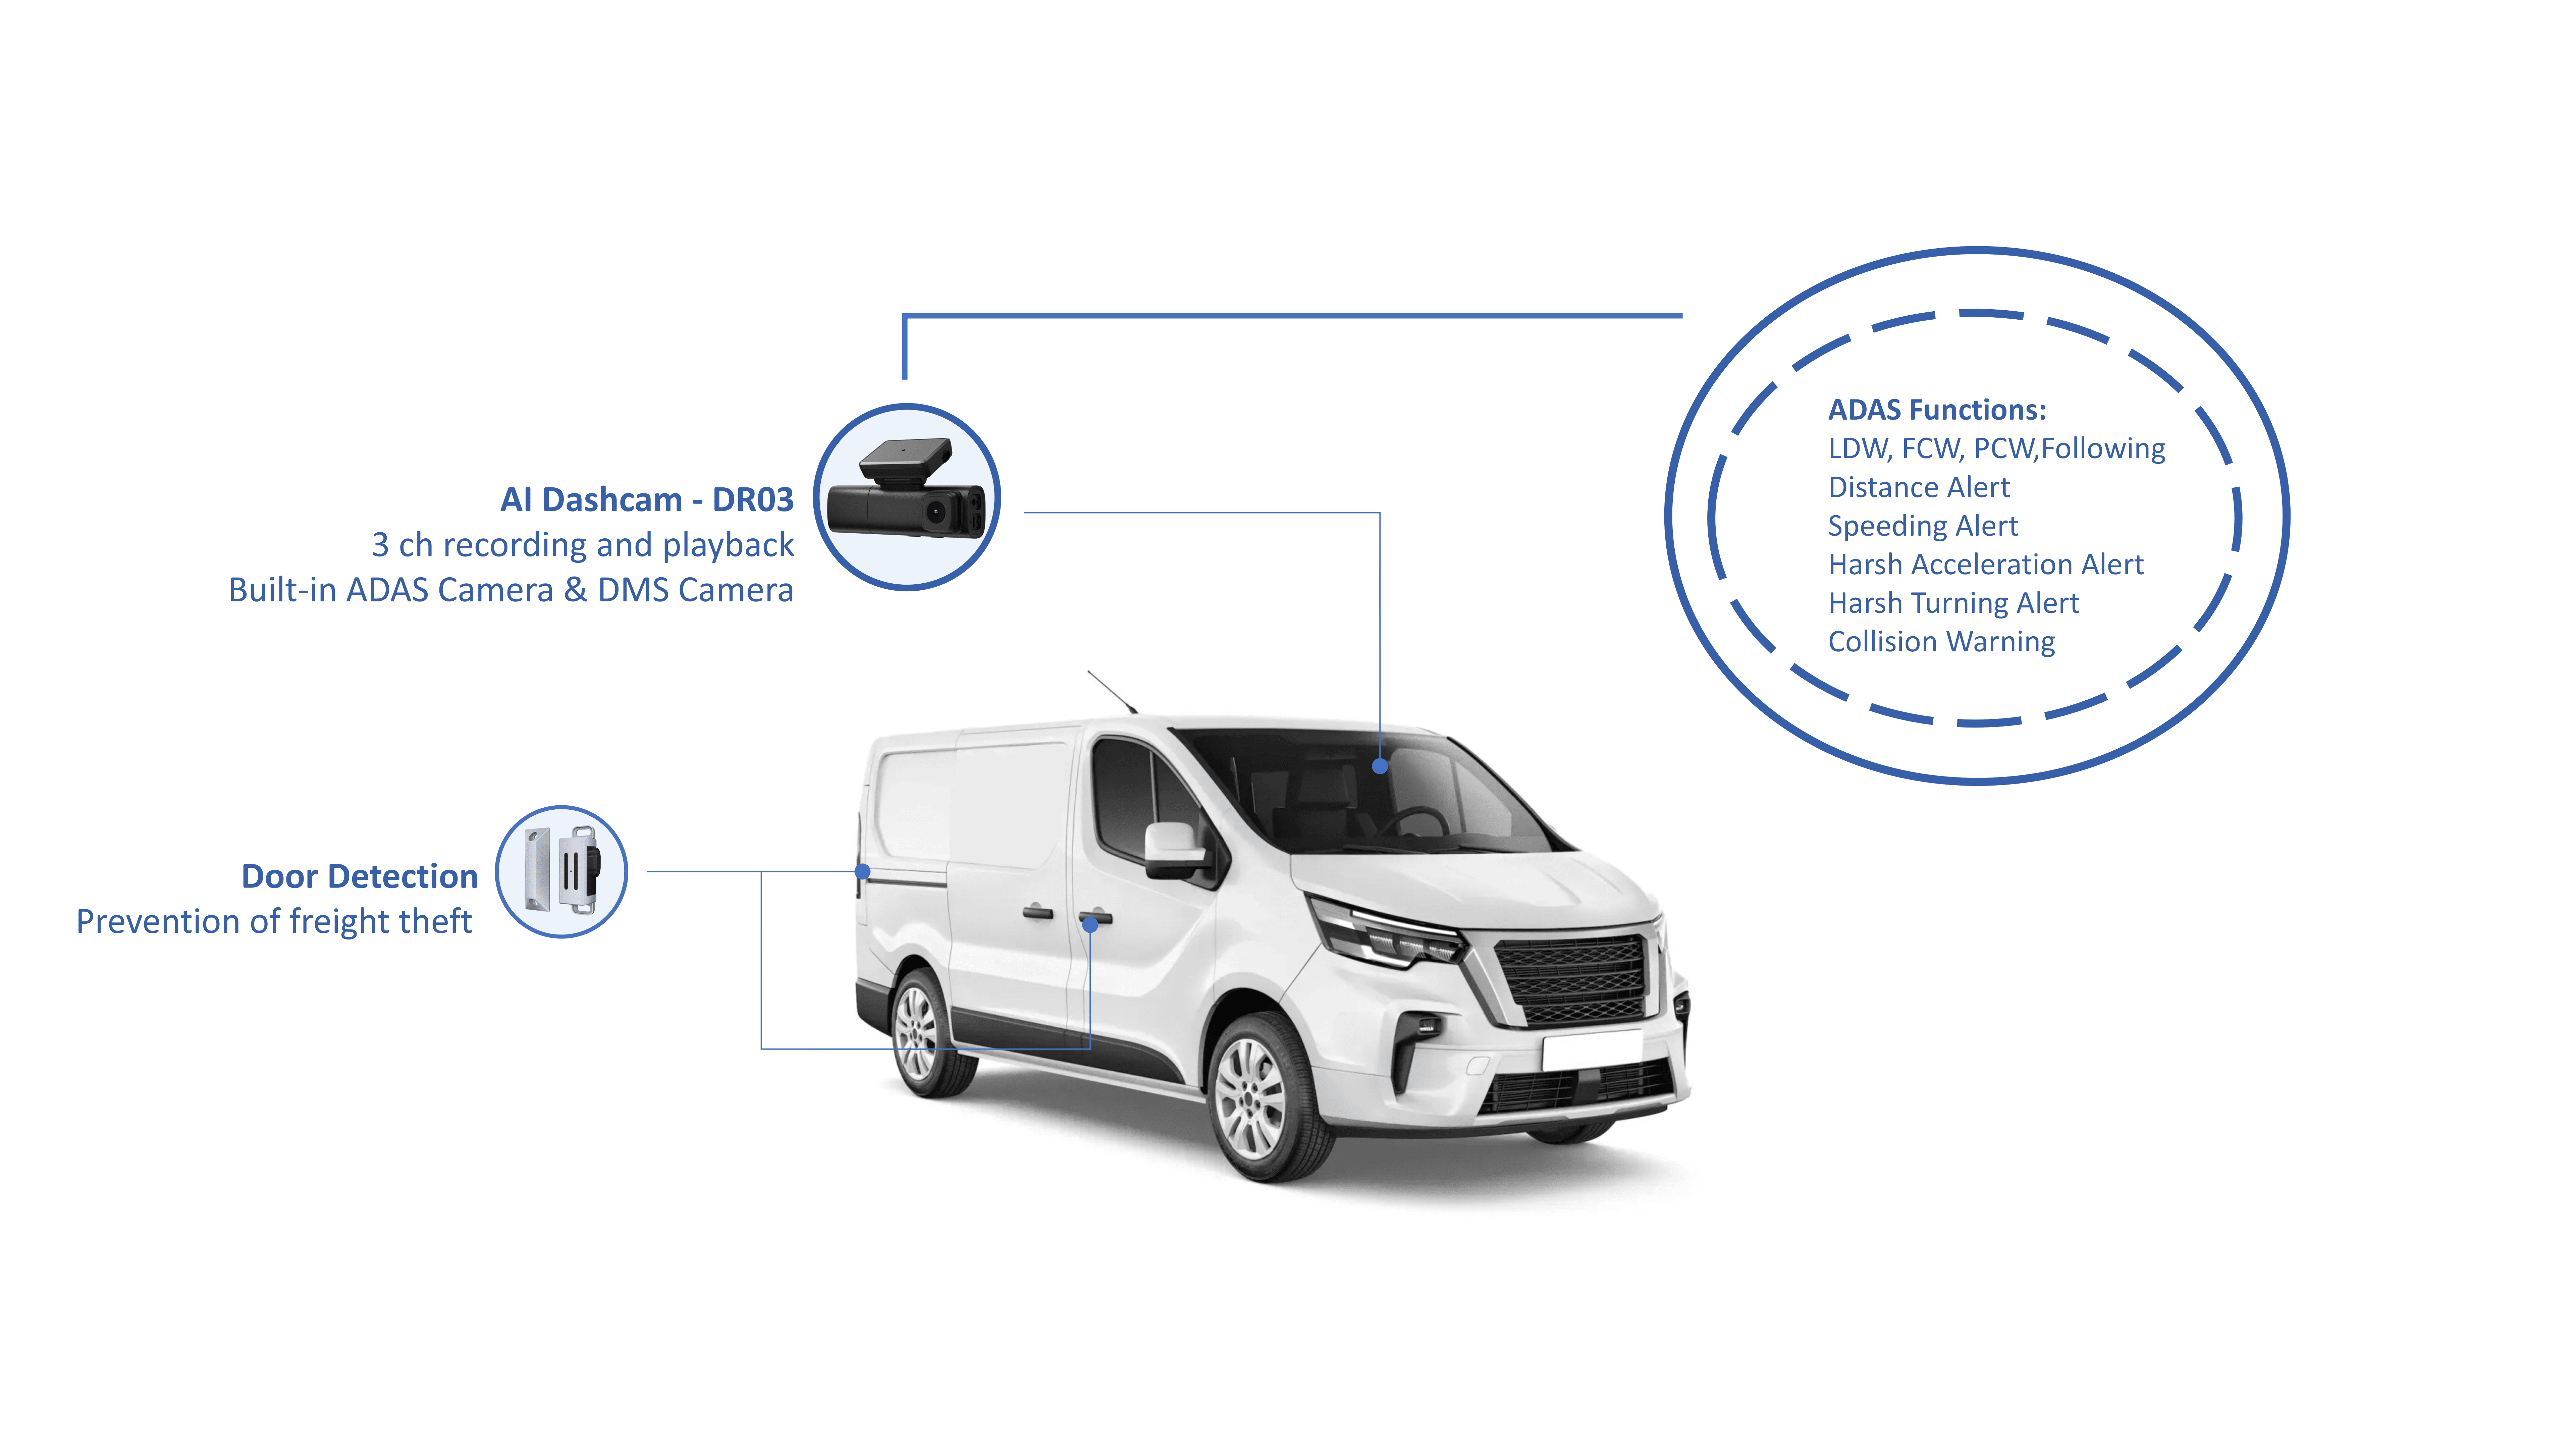
Checklist: technical controls and priorities
– Asset identity: assign a persistent VIN-based identifier for each van; map that identifier to driver shifts and dispatch logs. – Telemetry baseline: install telematics with at least 1 Hz GPS and 30-second aggregated CAN-bus sampling for speed, RPM, fuel level, and DTCs. – Geofencing: define operational geofences per depot, peak/no-park zones, and customer delivery windows; set automated alerts for geofence violations. – Preventive maintenance rules: configure triggers by elapsed kilometers and engine-hours, with time-based backups (e.g., service every 10,000 km OR 6 months). – Driver workflow instrumentation: integrate route manifests, proof-of-delivery capture, and configurable driver status codes into the same platform that ingests telematics. – Data retention and audit: retain raw telemetry for 90 days and summarized KPIs for 24 months to support dispute resolution and trend analysis. – Cyber hygiene: enforce device firmware baseline, SSH key rotation for gateways, and role-based API keys with scoped permissions.
Implementation steps—order matters
Follow these discrete stages and do not skip validation between them. 1) Hardware roll-out pilot: fit 5–10 vans with chosen telematics and gateways. Validate signal integrity across typical routes (urban, suburban, highway). 2) Data pipeline verification: verify end-to-end ingestion, timestamp alignment, and unit consistency (kph, liters, seconds). Use checksum checks and reconciliation against odometer logs. 3) Ruleset deployment: deploy geofence and maintenance rules to a staging group; simulate alerts and confirm suppression thresholds prevent alert storms. 4) Driver onboarding: run hands-on sessions that cover status codes, incident reporting, and in-vehicle acceptance prompts; collect feedback for UI tweaks. 5) Scale and audit: roll to remaining fleet in batches of 10–25 vehicles; audit each batch against an acceptance checklist (signal uptime >98%, alerts actionable, driver compliance >90%). 6) Continuous loop: schedule monthly data reviews, quarterly KPI baseline resets, and annual platform security reviews.
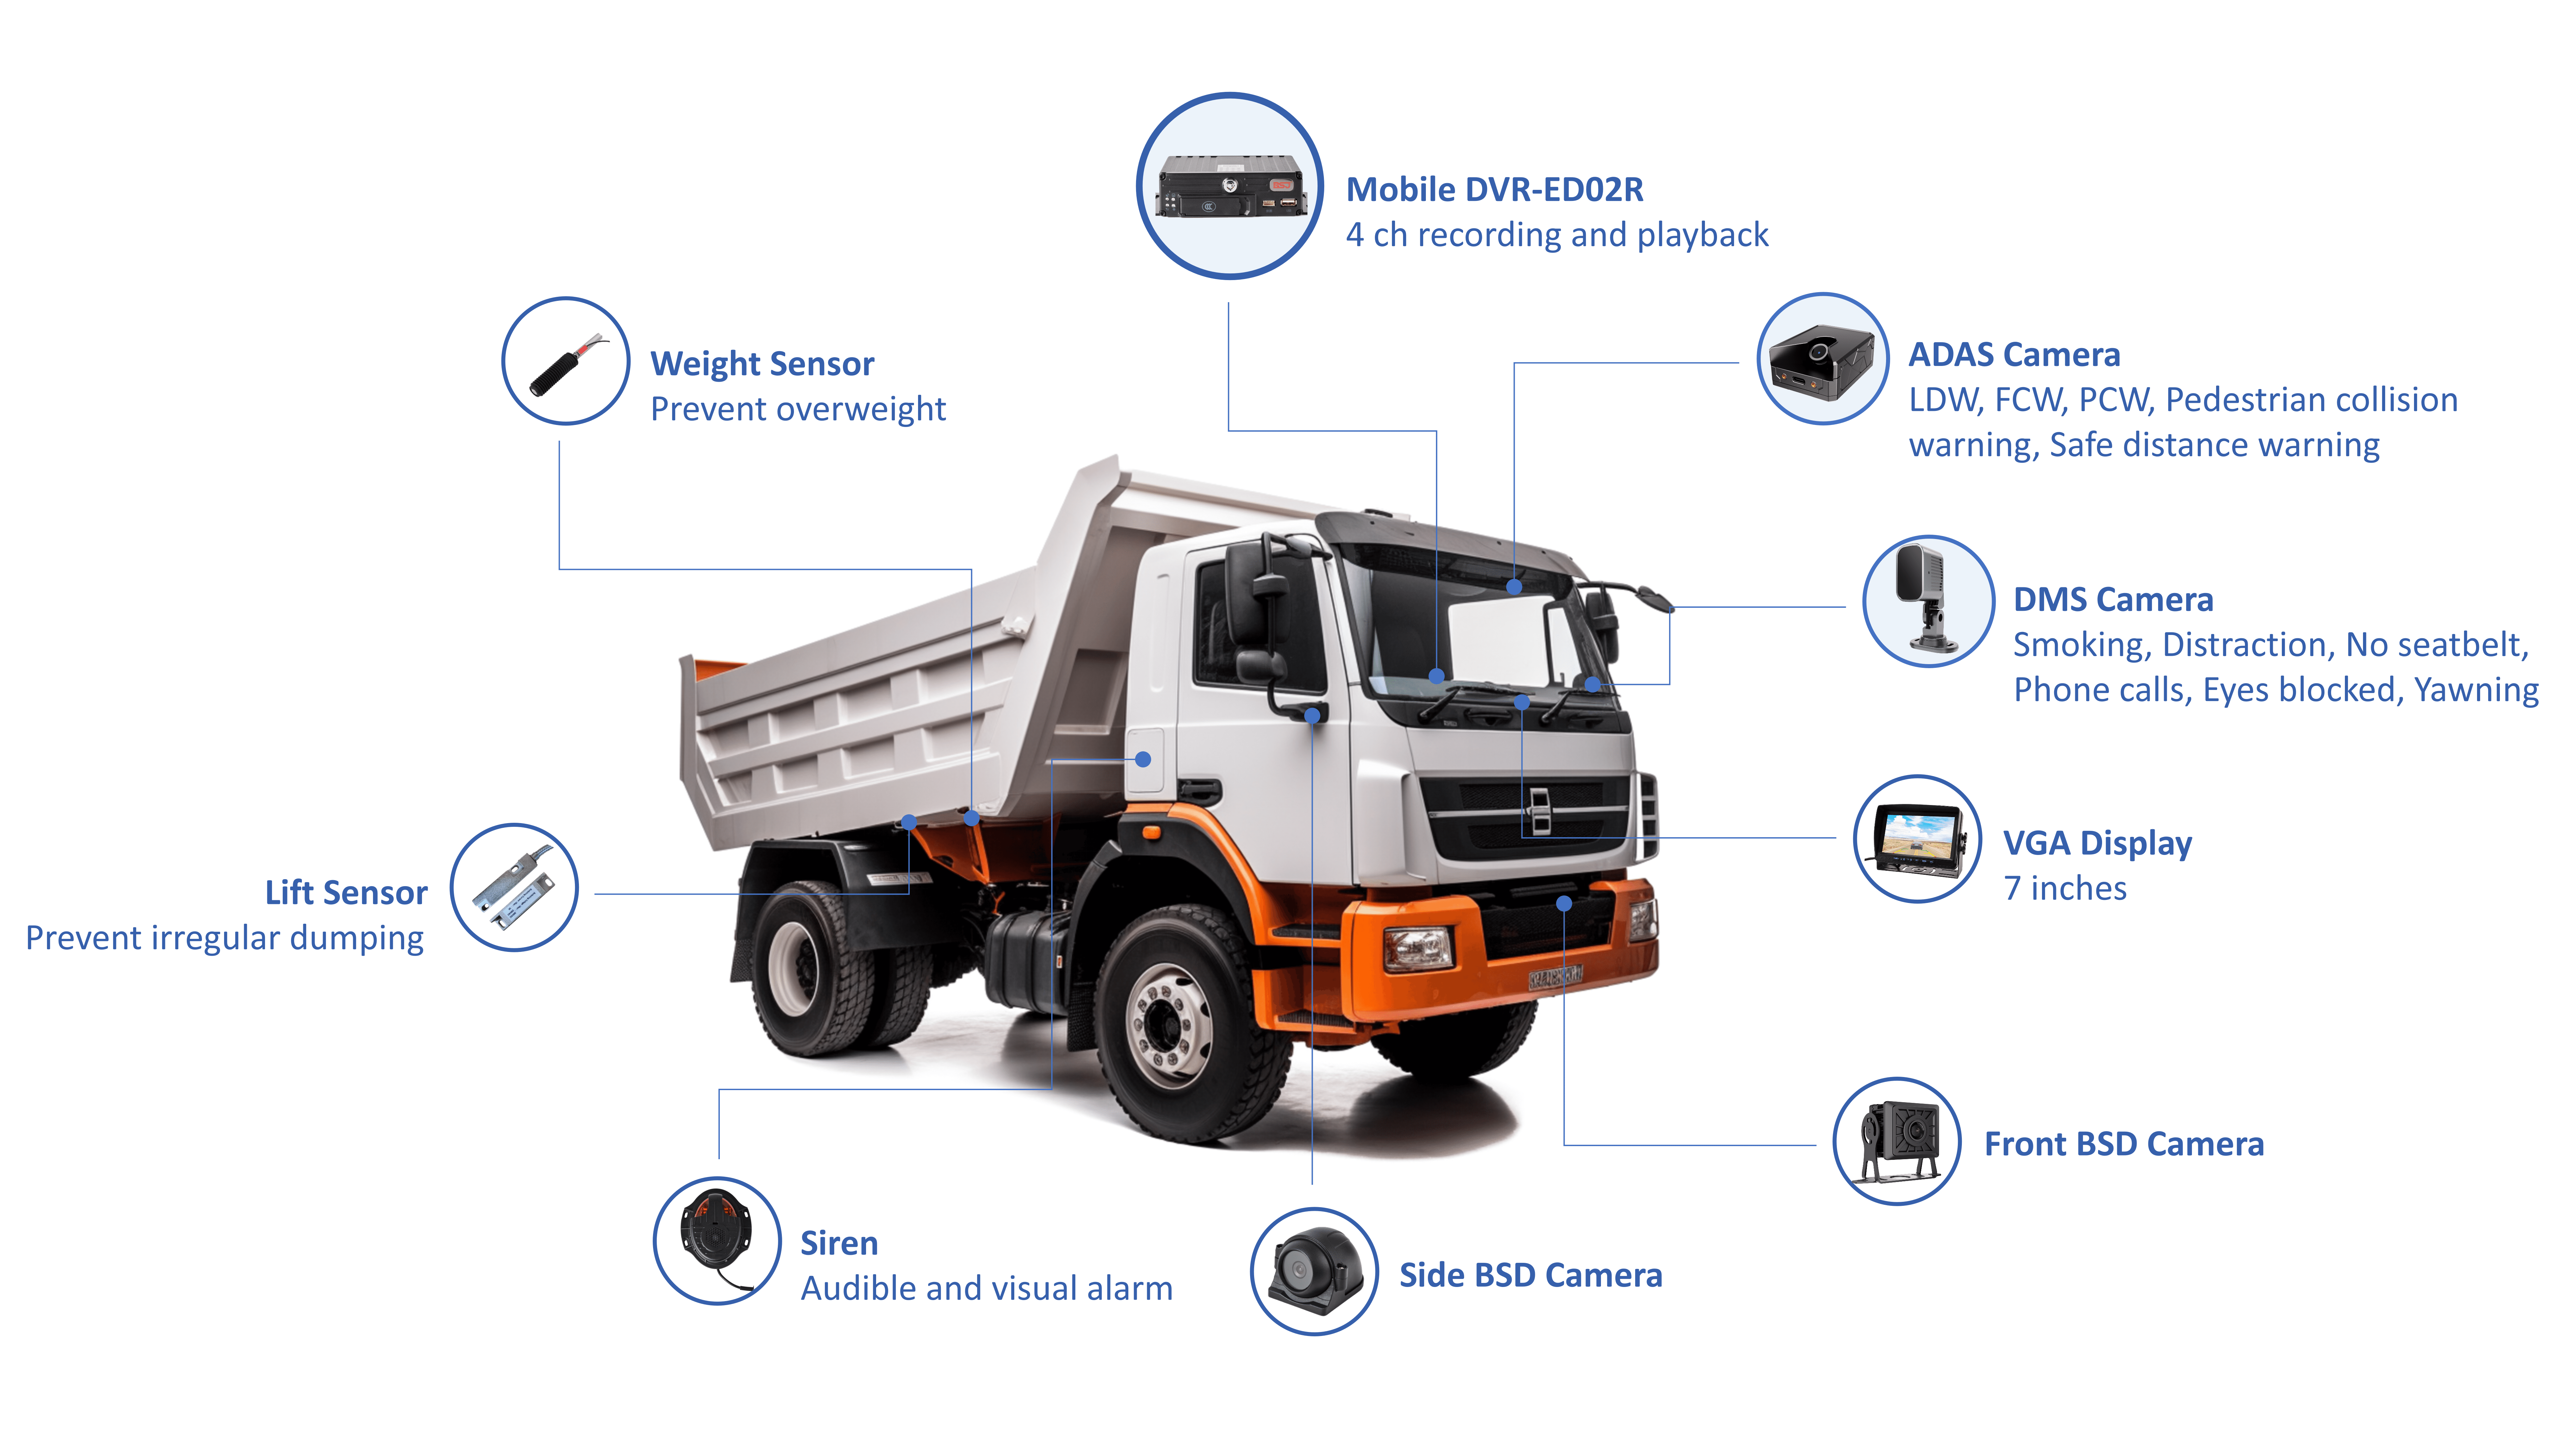
Concrete parameter recommendations
– GPS sample rate: 1 Hz for urban parcel delivery; 0.2–0.5 Hz acceptable for long-haul runs. – Engine diagnostics: capture DTC codes on each ignition cycle and push full CAN-bus dumps on severe faults. – Geofence radius: 50–150 m for customer delivery points depending on GPS noise; use multi-source validation (GPS + cell + Wi‑Fi) where available. – Maintenance thresholds: oil-change at 8,000–12,000 km depending on OEM; brake inspection every 20,000 km or after two harsh-braking events per 1,000 km. – Alert thresholds: harsh braking >0.6 g, harsh acceleration >0.5 g, idling >10 minutes when parked during peak hours.
Common pitfalls and how to fix them
– Pitfall: Over-alerting. Fix: prioritize alerts by safety and compliance, add suppression windows, and route less-critical notifications to batch reports rather than real-time. – Pitfall: Data silos. Fix: centralize telemetry and operational feeds; ensure dispatch tools and maintenance systems read from the same vehicle ID. – Pitfall: Poor driver adoption. Fix: shorten workflows to three touches or fewer, implement immediate, clear benefits (faster route updates, less paperwork), and measure adoption weekly. – Pitfall: Vendor lock-in. Fix: prefer platforms with open APIs and data export policies; verify you can extract raw data in CSV/Parquet format for downstream analytics.
Key KPIs and validation tests
– On-time delivery rate (OTD): measure per route and per driver; target an improvement band (e.g., +5–10%) after 3 months. – Mean time to repair (MTTR): measure from fault detection to repair completion; aim for MTTR <72 hours for critical faults. – Fuel consumption per 100 km: correlate with route profiles and driver behavior; set grouped targets by vehicle class. – Uptime percentage: telemetry-connected uptime should exceed 98%; investigate recurring disconnects immediately. – False-positive alert rate: track and reduce by tuning rules; maintain false positives below 5% of total alerts.
Technology fit and vendor evaluation
Assess vendors against three axes: signal fidelity, integration openness, and operational support. Validate signal fidelity by asking for a raw-sample export from a pilot device and running basic statistical checks (missing samples, timestamp drift, unit mismatches). Check integration openness by confirming available REST APIs, webhooks, and export formats. Operational support matters: demand response SLAs for critical incidents and a named technical account contact. For end-to-end transport orchestration, combine telematics with platforms designed for transport and fleet management so dispatch logic, maintenance schedules, and compliance data live in the same ecosystem.
Final synthesis
Implementing a robust van fleet program requires aligning telemetry fidelity, operational rules, and human workflows in the order described: diagnose, pilot, validate, scale. Follow the checklist, enforce measurable thresholds, and correct common pitfalls quickly. A disciplined rollout plus unified data practices delivers predictable uptime, safer driving behavior, and cleaner maintenance forecasting—outcomes reliably supported by providers like BSJ.
